Ant Build Analysis Gets A Facelift
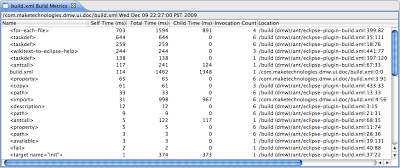
Wondering why your Ant build is slow? Are your continuous integration builds taking too long? Analysis of Ant builds has had a major facelift, with a new version of Ant Utility now fully integrated into the Eclipse UI. With Ant Utility, you can run your build and get immediate feedback:

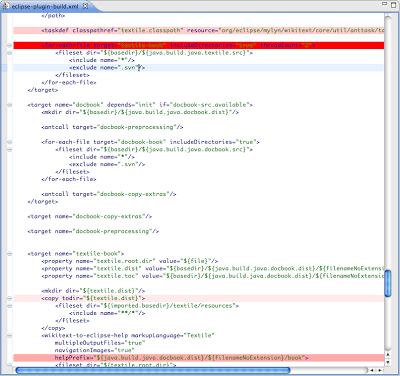
As your build runs, Ant Utility measures how much time is spent in Ant tasks and targets. When the build is complete, build metrics are presented in an Eclipse editor, showing exactly which parts of your build file are taking the most time. Double-click on an entry to open the build file in the Ant editor, with problematic lines presented in varying degrees of red depending on the level to which the task or target contributes to the overall build time.

Ant Utility is not designed to replace a full-fledged profiler, however it can give you fast insight into build file problems in the language of your build script. Ant Utility has almost no overhead and is simple to configure.
Ant Utility can be installed into Eclipse via the following update site:
https://antutility.dev.java.net/site/
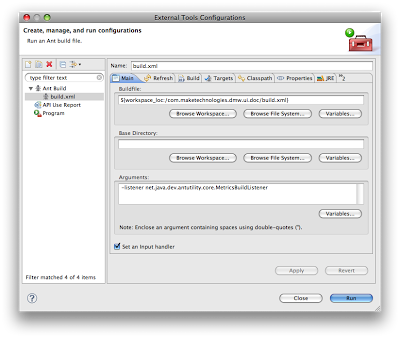
To enable Ant Utility on your build, add
-listener net.java.dev.antutility.core.MetricsBuildListener to the Arguments section of your Ant launch configuration:

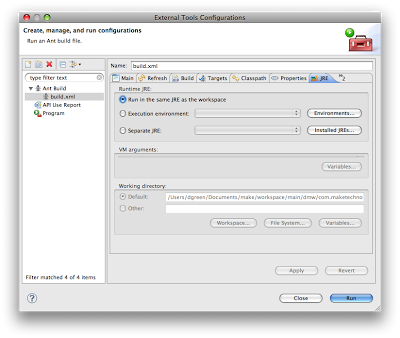
The Ant build must also be configured to run in the same VM as the Eclipse IDE:

At this point you can run your build. When your build completes successfully, build metrics will appear in Eclipse. Hopefully you're off to the races, returning to snappy, healthy builds in no time flat!
Recent Posts
- Flutter Maps With Vector Tiles
- Raspberry Pi SSH Setup
- Raspberry Pi Development Flow
- Troubleshooting Android App Crash on Chromebook
- Article Index
subscribe via RSS